In this article, you'll find:
In Successteam, we measure team members' perceptions within 12 primary indicators. All statements in a feedback loop are correlated to one of the primary four: Performance, Motivation, Satisfaction, and Stress-free. And one of our 3 subcategories: Individual, Team, and Leadership.
A simplified example is:
A leader decides on the frequency and number of statements in each feedback session. Yet, all sessions will always have a statement related to a minimum of one of the 12 Indicators. This allows us to update data within each indicator after each feedback session, providing leaders with valuable data regularly.
The format is simple!
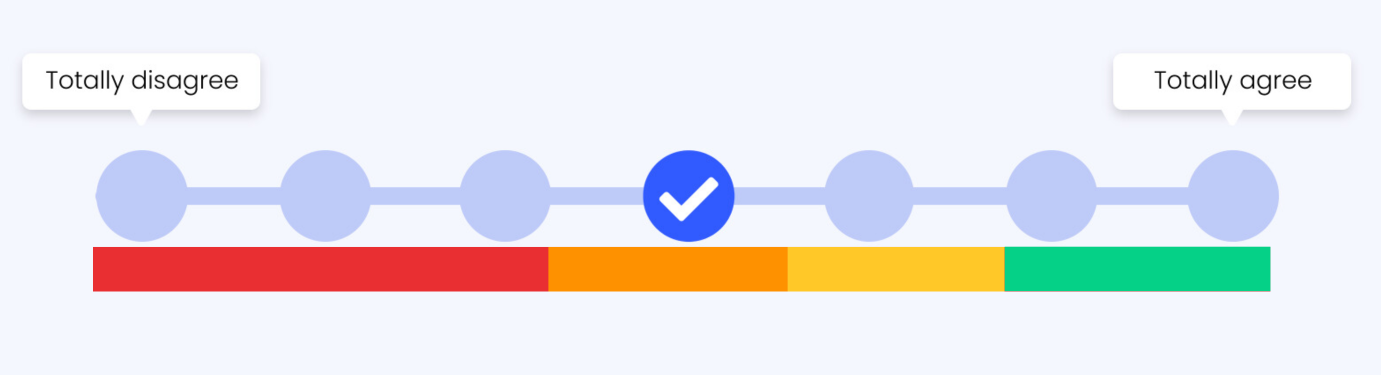
Each team member answers how much they agree with the statement. They answer from 0 (Totally disagree) to 6 (Totally agree). Then we calculate the data via a normal distribution.
What is a Normal Distribution?
Each statement has its own normal distribution, but as one statement is insufficient to give a meaningful indication (i.e., Stress in the Team), we collect data from many statements' normal distributions and merge them.
We display the team status and scores in colors to provide a simple and straightforward overview of a pretty complex algorithm. An indicator's normal distribution is shown as the average percent of all answers in a given period (default is 30 days back).
The colors act as a motivator to encourage leaders to take action when a majority of the team feels negatively about something. The colors also allow us to ensure anonymity for the team members because the result can't be "calculated" or "guessed" by the leader based on the score.
Team members must trust their responses are not directly shared with their leader. This way, leaders get the most honest and valuable feedback.
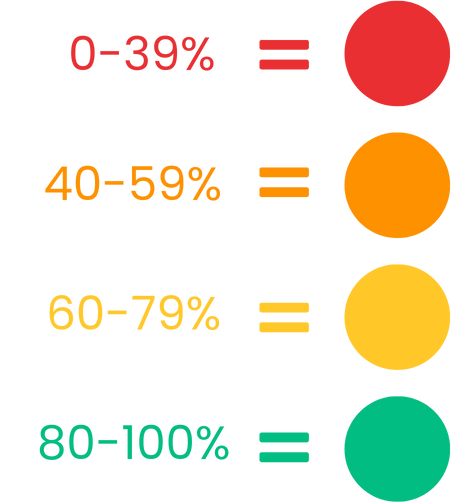
Here you have the distribution broken down in percentages. It means that when we have combined all given responses for a statement, the weighted average percent will fall within one of these ranges to the right.
The intervals are intentionally not equal because even though people might be neutral, we can always take some action to improve team wellbeing, and because we believe in continuous actions as teams are dynamic.
We focus on improvement and support leaders in always working towards more motivated, happy, and high-performing teams.
Practically this means that when people give feedback, their answers are calculated, as seen below.
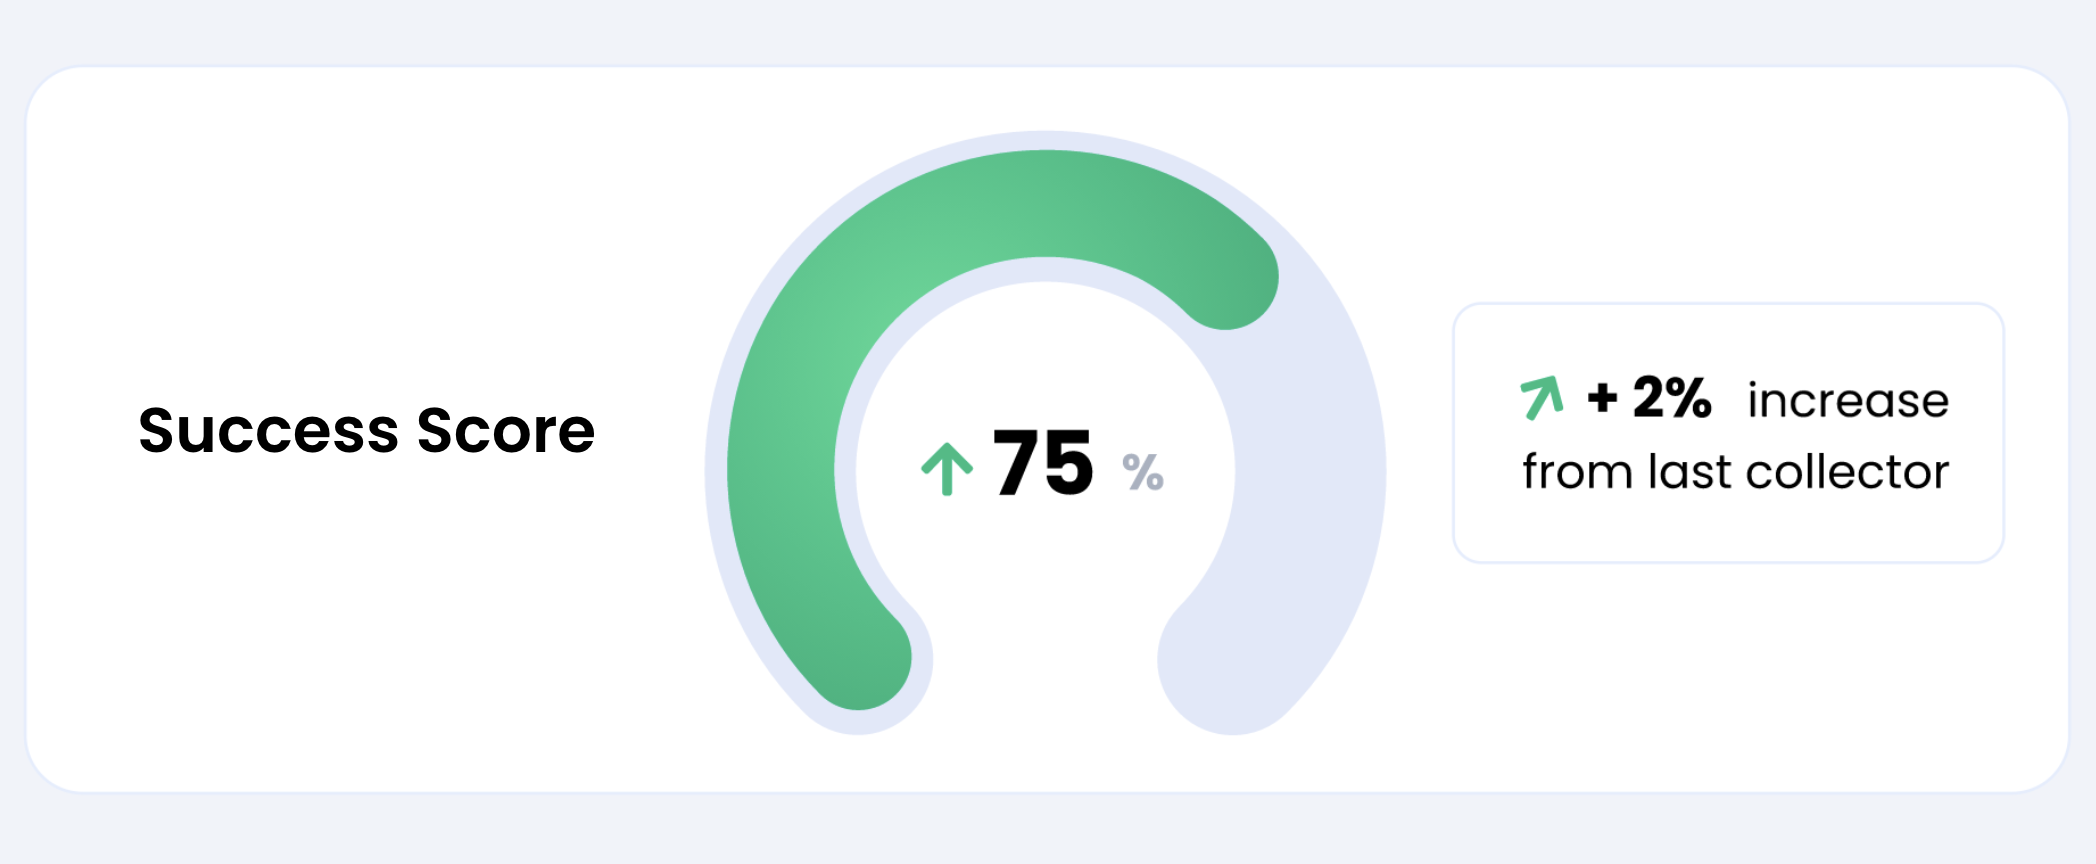
The point is to give you, as a leader, the most manageable and easy-to-understand overview when it comes to your team score and status. That is also why we have the "Success Score."
With this score, you can quickly see how high your team's average of all 12 indicators is, and you can track your increase or decrease over time, making it easy to understand if you are on track.
If you haven't created a workspace, do it now and become a Successteam. Otherwise, log in and start utilizing your team insights.🚀

Or, if you have any other questions, you can always email us at support@successteam.com or write to us in the Help chat from the website or platform.